Testing to determine training zones is a crucial part of any triathlete’s season. The goals of this article are to:
1. Show you why you should give yourself multiple attempts at each test you use
2. Graph the results of two real world testing cycles
3. Get you excited about the possibilities of doing your own testing
The examples provided include an example of an athlete just starting out, and one of an elite athlete testing with power for the first time. Power (measured in Watts) is an excellent cycling metric. It is a direct and immediate indicator of the work your body is doing.
You will be testing for Critical Power (CP) or Functional Threshold Power (FTP). This is (approximately) the power you can maintain for a 1-hour maximal effort. It is this number on which you will base training zones/levels. The running equivalent would be the pace you could hold for a 10-15K road race, lasting around an hour – sometimes referred to as Threshold Pace.
TWO TESTS
Note: Since going hard for a full hour is difficult for most people, more consistent (and useful) results are obtained via shorter tests. I will leave the detailed test descriptions for you to read in the text: “Training And Racing With A Power Meter” by Hunter Allen and Andrew Coggan, Ph.D., the go-to book on the subject. I also want to acknowledge Dr. Phil Skiba, a physician and top coach, who years ago got me into the multiple performance test format.
1. Single Long Effort Method – Functional Threshold Power (FTP)
This method involves a 20min test at maximal effort – trying to be consistent over the time vs. starting strong and fading. 95% of your average power for this test is your FTP. This test is described on page 50 of “Training And Racing…”. Also see the note on testing protocols at the end of this article.
2. Long and Short Effort Method – Critical Power (CP)
This method involves performing two tests, one lasting around 3min and the other around 20min. These are also maximal consistent efforts. Plotting these two points on a graph of power vs. time will give a line, and the slope of that line is Critical Power. As the authors note, and I have seen in practice, both methods give very similar results. This method is described on page 46 of “Training And Racing…”.
ATHLETE 1
MJ is a 39 year old male who had completed one triathlon and a short road race, but had never done performance testing. Training with power was new to him. He’s a good example of what can happen when you’re just starting out. MJ performed a short and long test on separate days.
Mo/ 20-min 3-min
Day Power Power
9/9 135watts
9/12 152watts
Method 1:
Per “Training and Racing…”, we take 95% of 135 to get FTP. FTP = 128 Watts
Method 2:
Don’t worry if you get lost here – just make it through the example. A watt is a Joule/second, so we convert each power number to Joules by multiplying by the time spent (in seconds) at that power. This gives how much total energy was expended in that time.
9/9 135watts(20min)(60sec/min) = 162,000 Joules
9/12 152(3)(60) = 27360 Joules
The slope of the line when these points are graphed is the difference in Joules divided by the difference in seconds:
Slope (Critical Power): (162000 – 27360)/(1200 – 180) = CP = 132 Watts
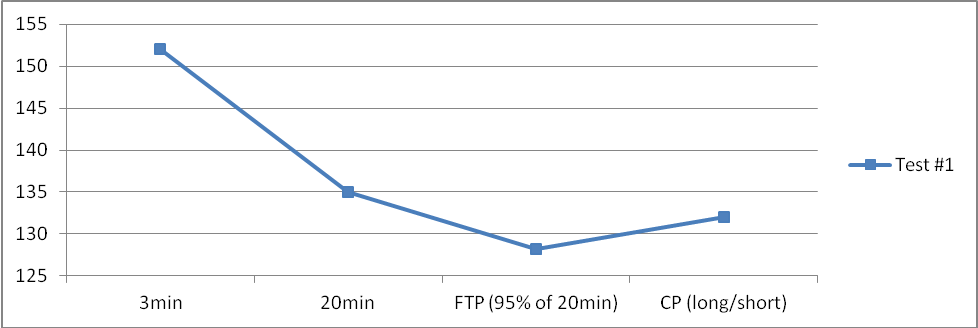
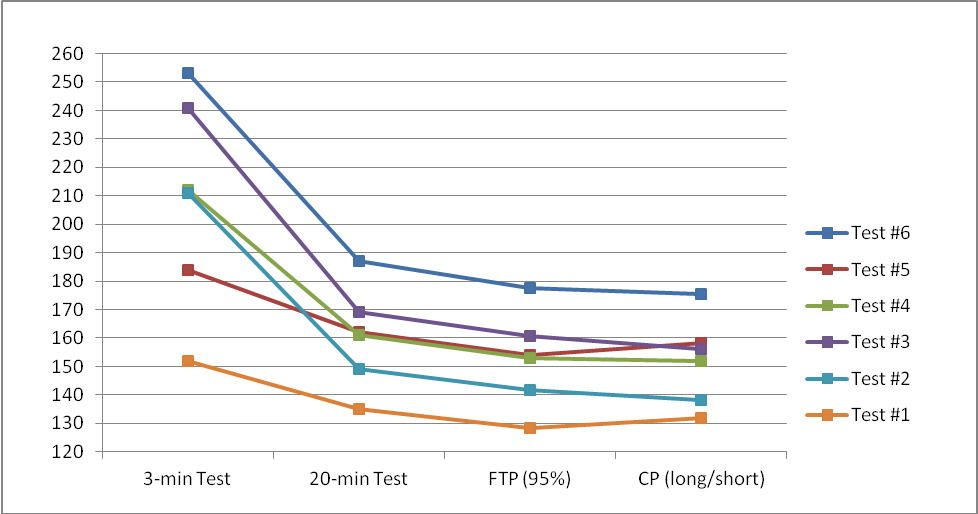
The vertical axis is in Watts. As you can see, the watts MJ can (predictably) hold for an hour (FTP, CP) is lower than what he can hold for 20min and far below the 3min number. Intuitively, this makes sense. The FTP and CP calculation methods give only slightly different answers. So, from these numbers, you could come up with some training zones and go to work. But that would be a mistake. Here’s why:
A SINGLE test gives you only ONE MOMENT in time, and who knows how you felt that day. Physically you may have felt good, even strong, but your power output may have been low. But how do you know? Do more tests. Here are two more data points:
Mo/ 20-min 3-min
Day Power Power
9/9 135watts
9/12 152watts
9/16 149
9/19 211
What happened??? These are BIG differences. Yes, they are, and only one week apart. MJ, with just a second try, had improved. But wait…
9/22 169
9/25 241 Another decent jump up. Wow.
9/30 161
10/3 212
10/6 162
10/10 184
Power has not improved for two weeks now. But are the improvements done?
10/13 187
10/17 253
I guess not. However, after six weeks of testing, we finally have some good numbers to work with. (You might ask, “If the numbers keep getting better, why not keep going?” My thought, based on prior experience, was that the percentage changes I was seeing would not continue and that the last two weeks were “best” efforts. This turned out to be the case, but you’ll need to make your own judgments regarding your results.)
This graph shows how MJ’s power tests progressed over time. The vertical axis is in Watts. As you can see, 3-min power increased 66% and 20-min power rose 39% over the 6-week test period. CP improved 33% using the long/short method.
Method 1:
95% of 187 = FTP = 178 Watts
Method 2:
9/9 187(20)(60) = 224400 Joules
9/12 253(3)(60) = 45540 Joules
Slope (Critical Power): (224400 – 45540)/(1200 – 180) = CP = 175 Watts
If the last two tests had come in below those of 9/22 and 9/25, we would have gone with the best out of the six, the earlier tests. But in this case, the final tests surpassed all others so we created zones from them. What just took place? Why did things work out this way?
1st Rule of Testing: You need multiple results to get a BEST result. Even if you’re experienced, test results can vary day to day. Don’t let your entire season ride, literally, on a single result. If MJ had trained based on his initial tests, he would have been working at two-thirds of his ability. What a loss that would have been.
2nd Rule of Testing: It takes multiple tries to become adept at any test. In the early tests, MJ started out strong but faded halfway through. You want consistency, and by the end he had it.
3rd Rule of Testing: You build fitness (and power) through the testing cycle. Hard 3 and 20min efforts give superb training results. The percentage improvement is much greater at the beginning of the season, or if you’ve never tested before. MJ would not do six weeks of testing mid-season – it might take only two tests to confirm improvement and a move to new training zones.
Now let’s add another variable, Heart Rate, which was measured during most of the power tests:
Mo/ 20-min Avg 3-min Avg
Day Power HR Power HR
9/9 135watts 150bpm
9/12 152watts 154bpm
9/16 149
9/19 211
9/22 169 148
9/25 241 145
9/30 161 140
10/3 212 161
10/6 162 153
10/10 184
10/13 187 164bpm
10/17 253 162bpm
These are also interesting. Many people do a single HR test, perhaps a 30min effort taking the average HR for the last 20min and using that as their “Threshold” heart rate (HR they could maintain for a one hour maximal effort). A single test is a mistake because HR can vary widely, and it doesn’t always match up with power output, although in the end, the top HR and power numbers coincided. Training with correct HR zones gives very good results, but multiple HR tests should be done given the large variation possible.
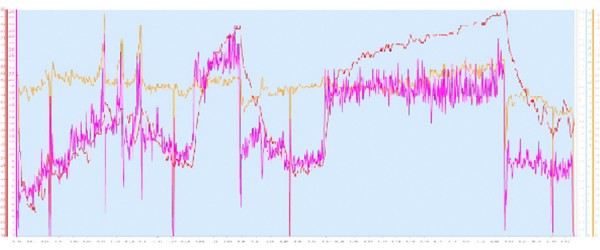
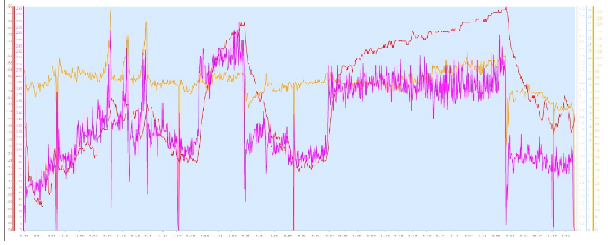
Note: Why were the 3min HRs no higher than the 20min HRs when the effort was so much greater? It takes some time for HR to ‘catch up’ to real output, and 3min is barely enough, especially early in a workout or set. This is a good lesson to learn, since you may start up a tough hill and HR may be low for a while before it conveys real effort. Power is nice because you know effort immediately and can moderate it according to terrain. It takes time to get a feel for how your HR responds – a good feel for perceived exertion is crucial. Below is a graph from a power test. Power is purple, heart rate is red. The second elevated block of power is the 20min test. As you can see, power stays reasonably level, while heart rate rises continually. This is its nature, to be a lagging indicator. Given more time, heart rate would have stopped rising and leveled off. This is one reason some popular heart rate tests have you do longer hard efforts, and then use data from the final two-thirds of them, giving heart rate a chance to become steady-state, or closer to it. After the test, you can see that reduced effort was immediately evident by the drop in power, but heart rate took a long time to fall back down.
ATHLETE 2
RC is an elite athlete who wins some local triathlons and places highly in his age group around the region. He invested in a power meter after a season and a half of working with heart rate. By this point it was summer, and he had been through extensive training and testing (HR). Here’s how his power efforts came out:
Mo/ 20-min 3-min
Day Power Power
6/26 233watts 304watts
6/29 302
7/3 265
7/11 260
7/24 260
7/27 324
7/29 285
8/4 338
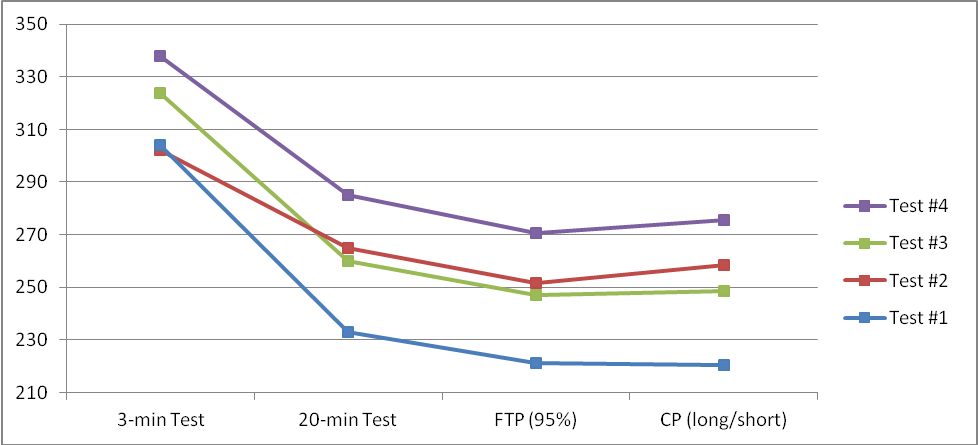
And the corresponding graph:
Method 1:
95% of 285 = FTP = 271 Watts
Method 2:
7/29 285(20)(60) = 342000 Joules
8/4 338(3)(60) = 60840 Joules
Slope (Critical Power): (342000 – 60840)/(1200 – 180) = CP = 276 Watts
RC tested differently than MJ. His 20-min results improved by a greater percentage than his 3-min. I almost stopped the testing in mid-July, thinking he might have reached steady-state for this cycle, but I wanted another 3-min effort. When his power there jumped, I gave him another couple tests in both timeframes, which turned out to be worthwhile.
Even though RC was a seasoned athlete, his tests improved over the course of six weeks. Critical Power improved 24%. Much of this can be attributed to getting used to the tests. Since he had been training extensively, it is highly unlikely that he would improve this much in six weeks. At the time he was doing other work getting ready for an Iron-distance event, so performing maximal efforts took some getting used to. He usually had a light day before a test day but was never fully rested. We needed solid test data that he could race with in the near future, so we had to do a full test regimen.
Note on testing protocols: The two athletes in the previous examples performed their 3- and 20-min tests on different days whereas the FTP test in “Training and Racing…” places a hard 5-min effort prior to the hard 20-min effort. I do the FTP calculation here for example only. If you want the best number for FTP you must do the test as designed. However, it will be very close to CP as shown.

